Scatter Plot

Data:
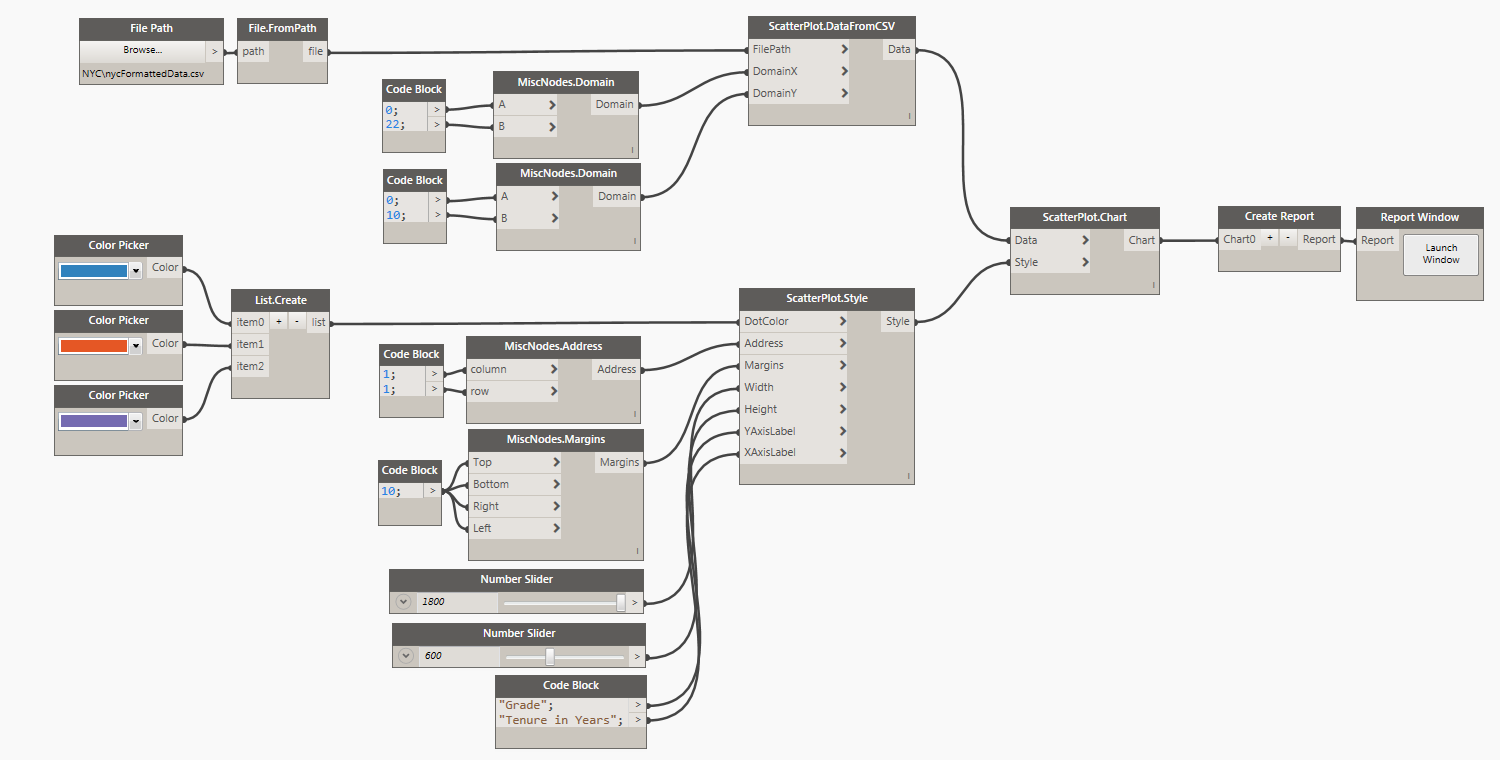
There are two ways of defining data for a Scatter Plot Chart. First is to use a CSV file that was formatted in the following way:
- First Column is always Name of the data point.
- Second Column is always the numerical ValueX for the data point. Since Scatter Plots chart data in 2 dimensions this is the X-axis value.
- Third Column is always the numerical ValueY for the data point.
- Next is Size. This is in a range between 1-10 where 1 is the smallest dot size.
- After that is the Color. This is again a numerical value. If all data points have the same value assigned, they will all have the same color. If values are different, they will be assigned a color from
Sategory20c.
Example:

Another possible way is to define the data in Dynamo directly and then use the node ScatterPlot.Data to define all of the desired data points. Here's a potential sample of defining data in Dynamo:
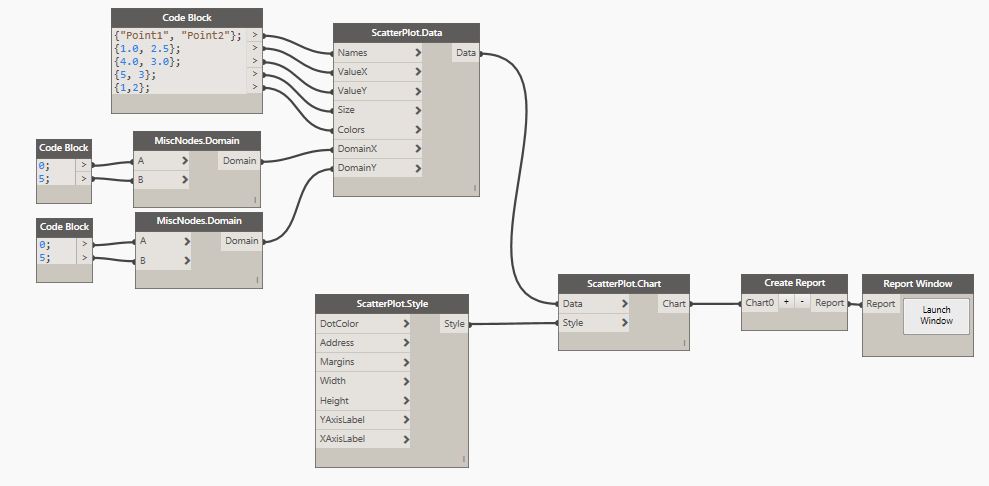
Tip: As you can see in the image above, since Scatter Plots chart data in 2 Dimensions, there are actually two (2) inputs for a domain. One is for X-axis while second is for the Y-axis.
Style:
Scatter Plot Chart Style has a few simple things that can optionally be defined to control the visual appearance of the chart. First input is for controling the dot color. You can either use a Dynamo Color node or a little bit of DesignScript syntax and a Code Block to define that input. Example: DSCore.Color.ByARGB(1,220,180,20). If you define multiple Colors in the data, and then supply a list of colors here, for them to be assigned properly. Width and Height are integer inputs that by default are set to 1000px x 500px. The actual size of the chart is always a little smaller because of margins required for handling axis graphics etc. Address input can be used to place the chart in a specific location on a page. Grid address represents charts top/left corner. Please see this page for more info on Address. Margins come handy when you need to increase space around the chart to accomodate labels. Please see this for more info. Example of a Scatter Plot Chart rendered above and its style:
Tip: Chart Address gets reset every time you refresh the page. Page refresh happens on every data or style change. Use Address input to "lock" charts to their position on page, otherwise you will have to move them around a lot.