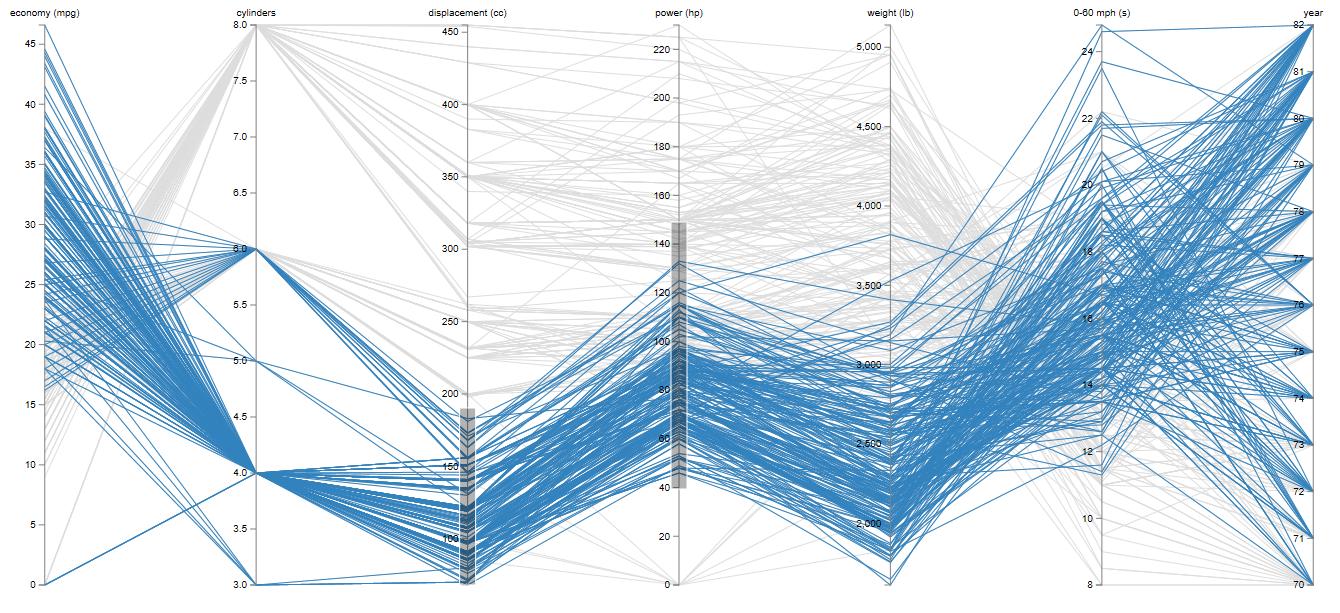
Parallel Coordinates
Data:
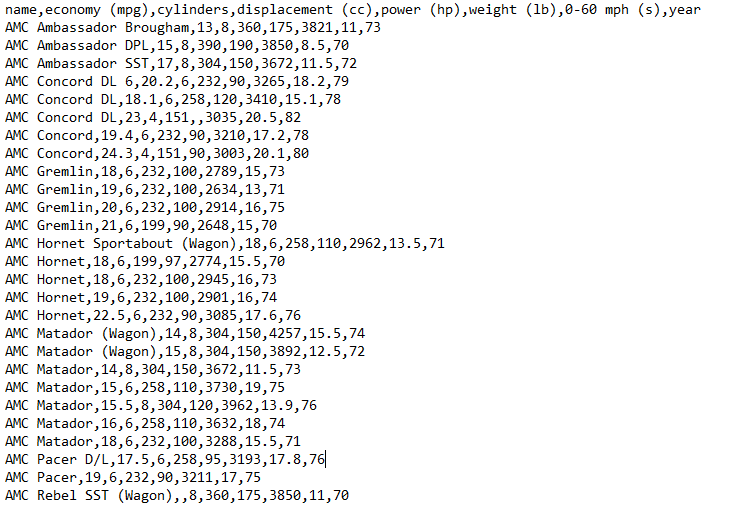
There are two ways of defining data for Parallel Coordinates Chart. You can use a CSV file formatted in the following manner:
- First row is always Headers. Headers contain names of individual axis in each group or if you wish for each parameter. In our example its the different properties of the car.
- All of the consecutive rows are considered data points. These are all of the Axis with each row starting with a Axis Name and then values for each data point.
Example of CSV data:
Another way to define data is to generate it from a list directly in Dynamo. You can do it like so:
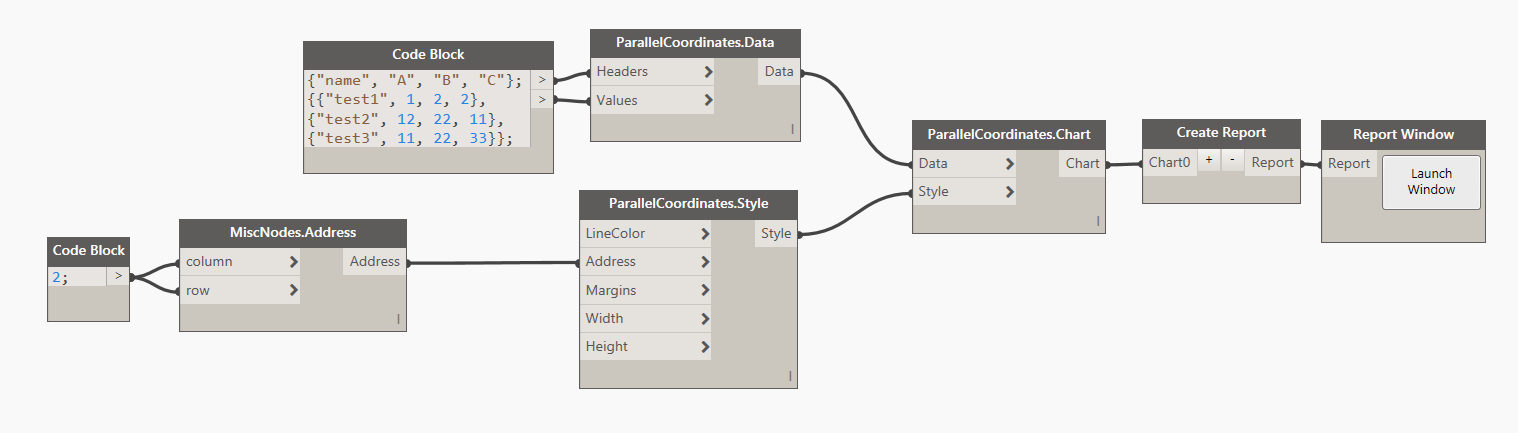
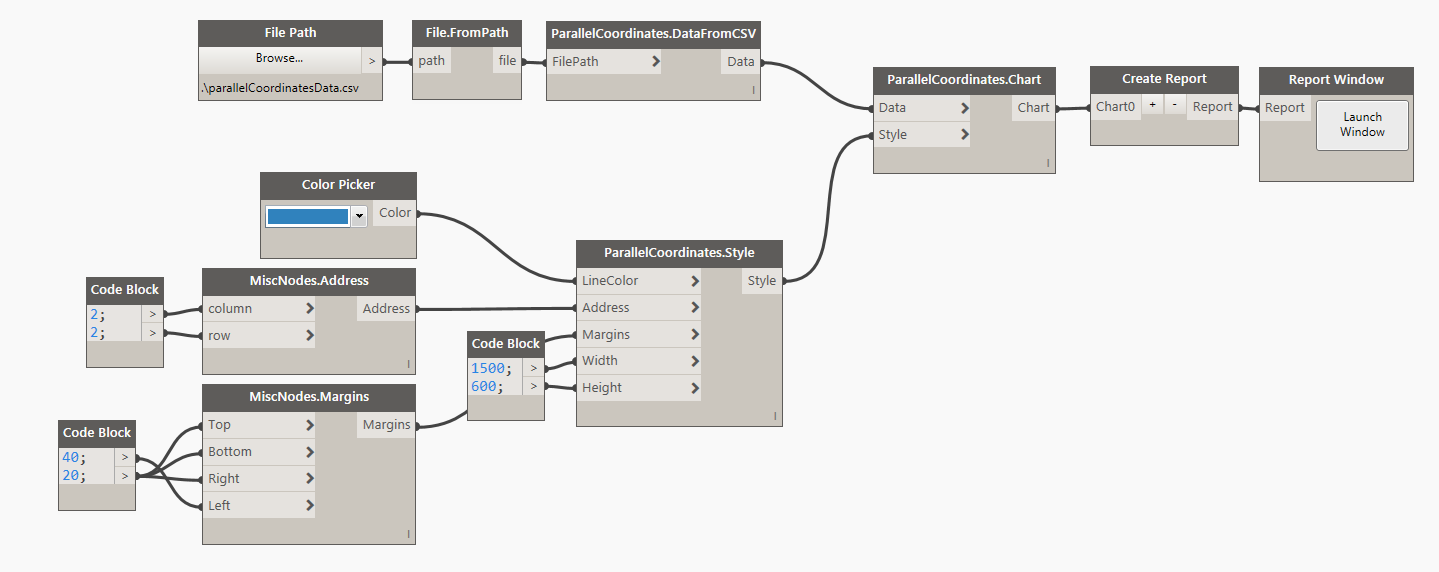
Style:
There are couple of things that you can define for the appearance of the Parallel Coordinates Chart. First is a Line Color. You can use a Dynamo Color node to define that input or you can use the Design Script syntax like so: DSCore.Color.ByARGB(1,100,100,100). Remaining inputs are integers for Width and Height (default values are 1000px x 500px).
Other:
Tip: A range for each axis is determined automatically between min-max values used for that axis. Tip: Parallel Coordinates Charts are probably most useful for data samples that contain more than couple hundreds sample points. For things that only contain a handful of data points, please consider using a Stacked Bar Chart or even a Grouped Bar Chart.