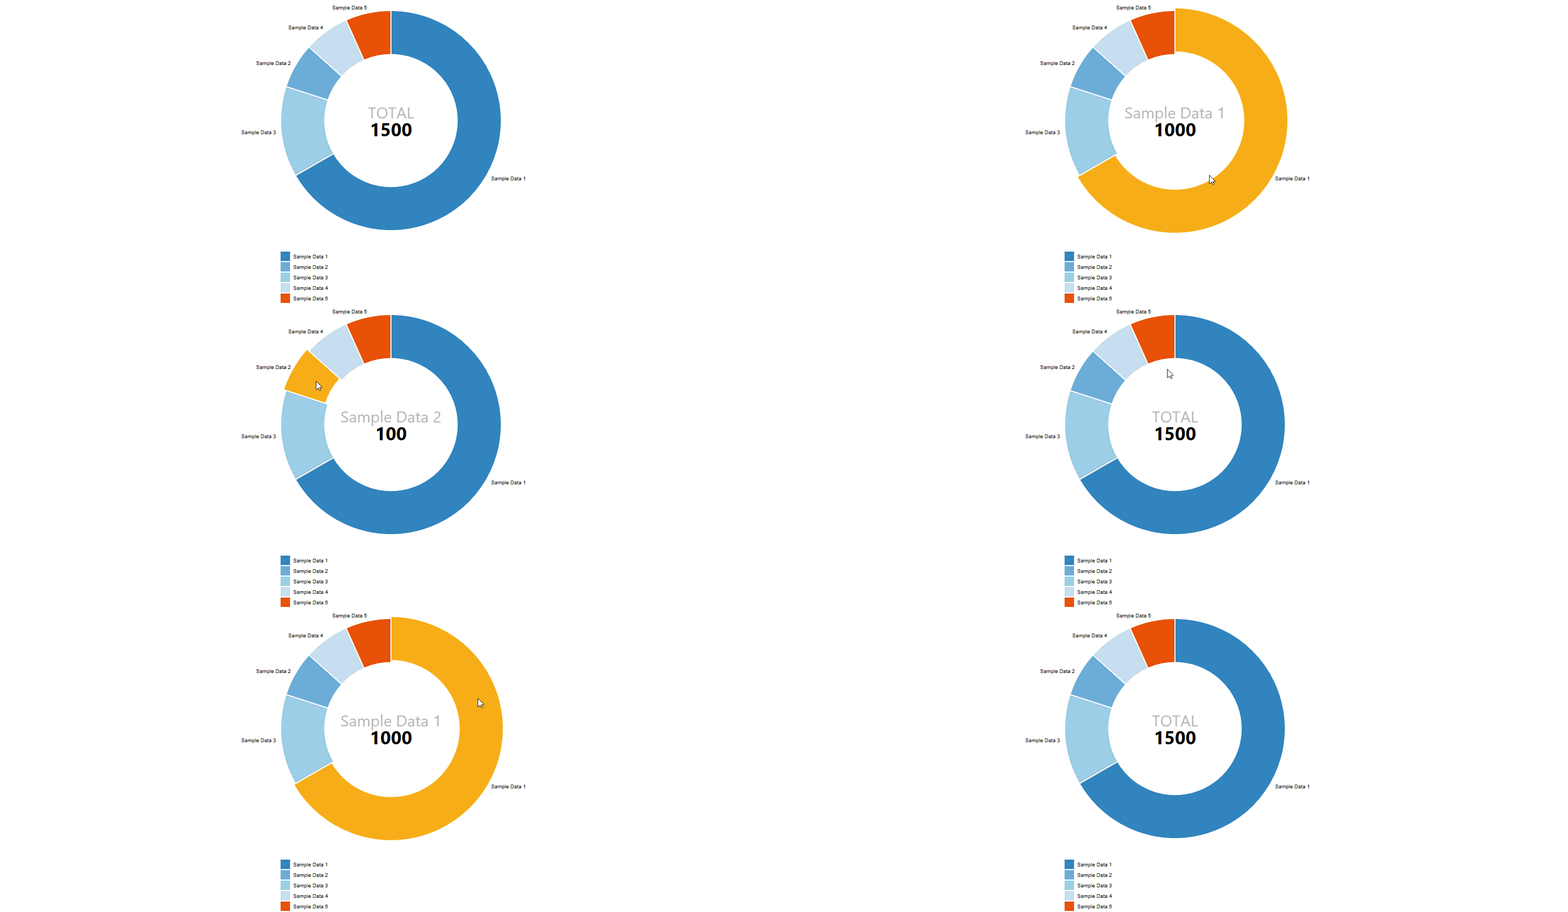
Donut Chart
Data:
There are two ways of defining data for a Donut Chart. First is to use a CSV file that was formatted in the following way:
- First Column is always Name of the data point.
- Second Column is always the numerical Value for the data point.
Example:
Another possible way is to define the data in Dynamo directly and then use the node DonutChart.Data to define all of the desired data points. Here's a potential sample of defining data in Dynamo:
Style:
Donut Chart Style has a few things that can be set optionally to control the visual appearance of the chart. First two inputs are for controling a color. You can either use a Dynamo Color node or a little bit of DesignScript syntax and a Code Block to define that input. Example: DSCore.Color.ByARGB(1,220,180,20). Colors input accepts a list of colors if you wish to give each slice of the chart/data its own color. Width and Height are integer inputs that by default are set to 1000px x 500px. The actual size of the chart is always a little smaller because of margins required for handling label graphics etc. There is also a boolean inputs for Labels. If set to true, labels will appear around the chart in a sun-ray style. If you are using Labels, you might want to set the margins for a chart to create space around it. Please see this for more info on Margins. Please see this page for more info on Address.
Other:
Legends:
Donut Chart no longer has a legend that can be toggled on and off. It was intead repleaced with a whole new component called legend. Please see the [legend](legend.md) page for more info.
