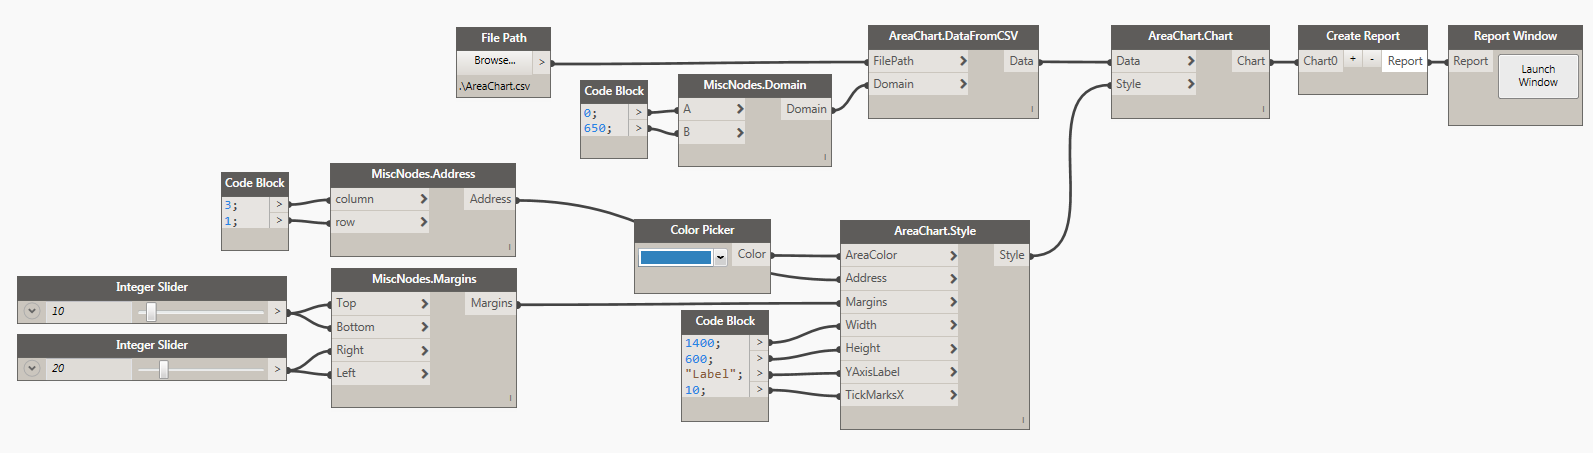
Area Chart
Data:
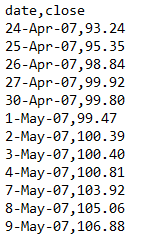
There are two ways of defining data for a Area Chart. First is to use a CSV file that was formatted in the following way:
- First Column is always Name of the data point.
- Second Column is always the numerical Value for the data point.
Example:
Another possible way is to define the data in Dynamo directly and then use the node AreaChart.Data to define all of the desired data points. Here's a potential sample of defining data in Dynamo:
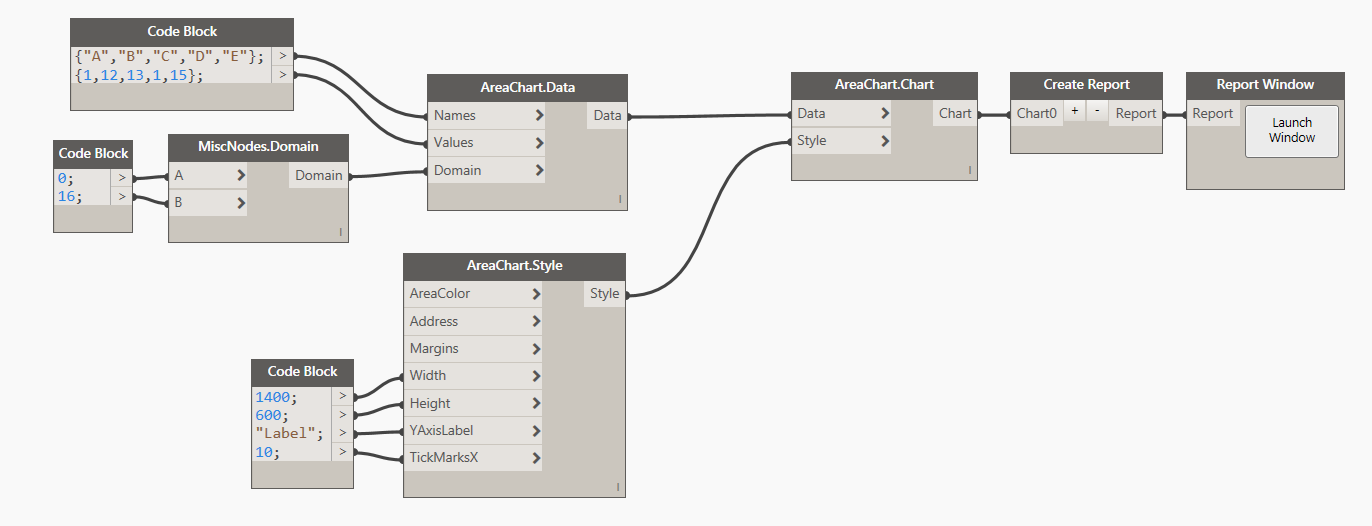
Tip: As you can see in the image above, ALWAYS define number of Tick Marks in Chart Style to be equal or less than a number of data points. Specifying more ticks marks will result in an error. Default value is 13.
Style:
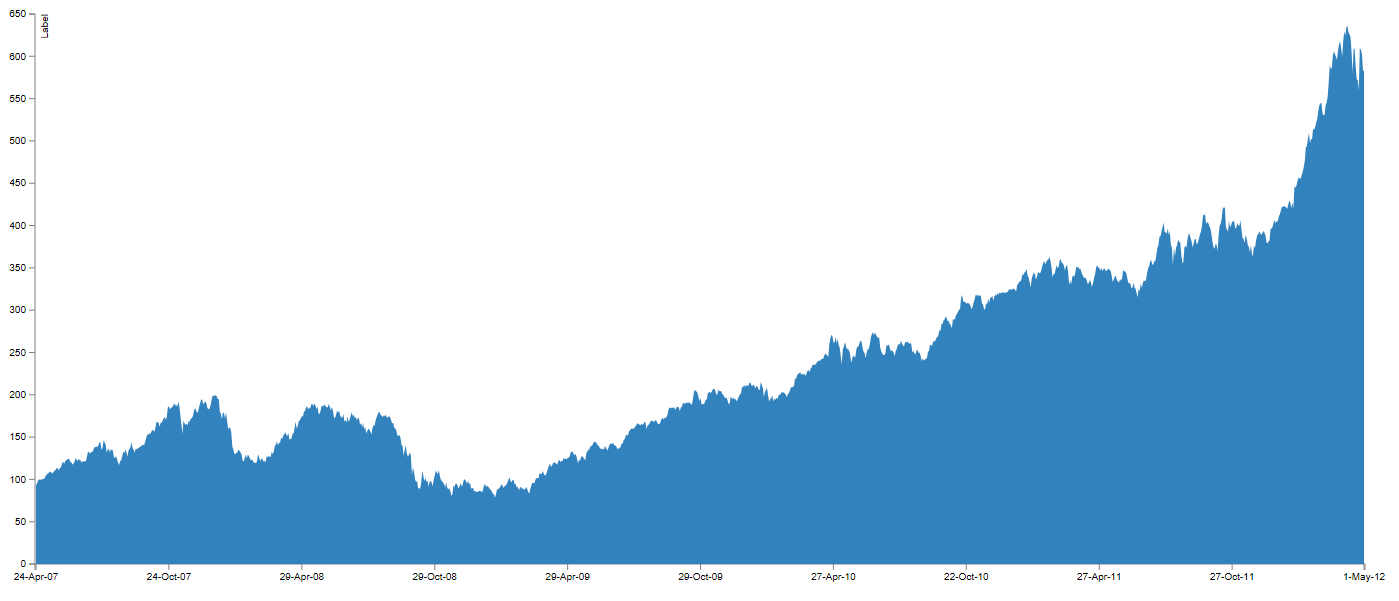
Area Chart Style has a few simple things that can optionally be defined to control the visual appearance of the chart. First two inputs are for controling a color. You can either use a Dynamo Color node or a little bit of DesignScript syntax and a Code Block to define that input. Example: DSCore.Color.ByARGB(1,220,180,20). Width and Height are integer inputs that by default are set to 1000px x 500px. The actual size of the chart is always a little smaller because of margins required for handling axis graphics etc. TickMarksX are an integer input. These define a number of data point names that are being displayed below X Axis. If you have a small data sample or really short names then it makes sense to render them all, but if you have a large data sample, to avoid overlapping text just enter a value that displays less names. Please see this page for more info on Address. Margins come handy when you need to increase space around the chart to accomodate labels. Please see this for more info. Example of a Area Chart rendered above and its style: